What is Data? And 3 things it can do to upgrade your business
There is a lot of discussion around data and how people and companies are using it. But what really is “data” and how is it helpful to you and your business?
What is data?
Simply put, data is information. It can be information you are purposefully keeping track of (things like sales receipts, customer details, order invoices) or it can be meta-data, which is data about data (the location files are saved, file size, dates, tags, etc.). Data can also be information kept or tracked by tools and devices: smartphones and other smart-devices, social media platforms, websites, etc. Finally, data can also be information collected by other people and organizations as well; think surveys.
How is data helpful?
Information can help you better understand the world around you, make informed decisions and even prescribe next steps. It helps you save money, make clearer decisions, and helps you serve better as well. When you buy a car, you use data to help you not only assist in finding a dealership or private seller with cars at a good price, you also are using data, in the form of reviews, from other previous owners and experts to help you select the right vehicle.
Imagine you own a restaurant and you’re trying to make your food orders for the next week. Data or information about how much food was consumed last week helps you choose the correct amount for purchase for the future. If you own a small boutique and are trying to schedule your employees for the next few shifts, data about customer purchase trends (or sales made) can help you schedule the right number of employees.
Once you have data, what can it do for you? There are three main things: describe 📊, predict 🔮, prescribe 💊.
Describe 📊
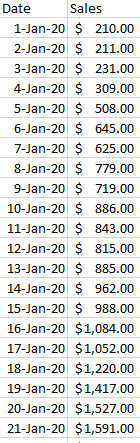
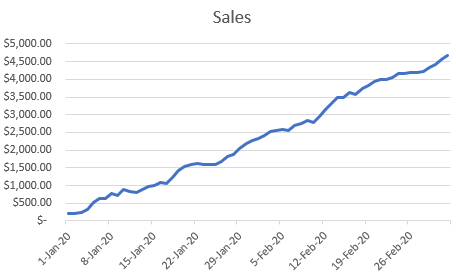
Data can help describe what is happening or what has happened. Visualizations and dashboards are examples of how to describe data using engaging displays to understand a large amount of data, quickly. You could count all of your sales manually for each month, or put them in a spreadsheet with two columns showing the date in one and the sales in the other, or you could allow a visualization tool to add it all together for you and present it in a nice line chart, and update automatically.
If you want to save time and money, tracking goals and KPI’s can become much easier if you can get the right data and visualize it in the right way.
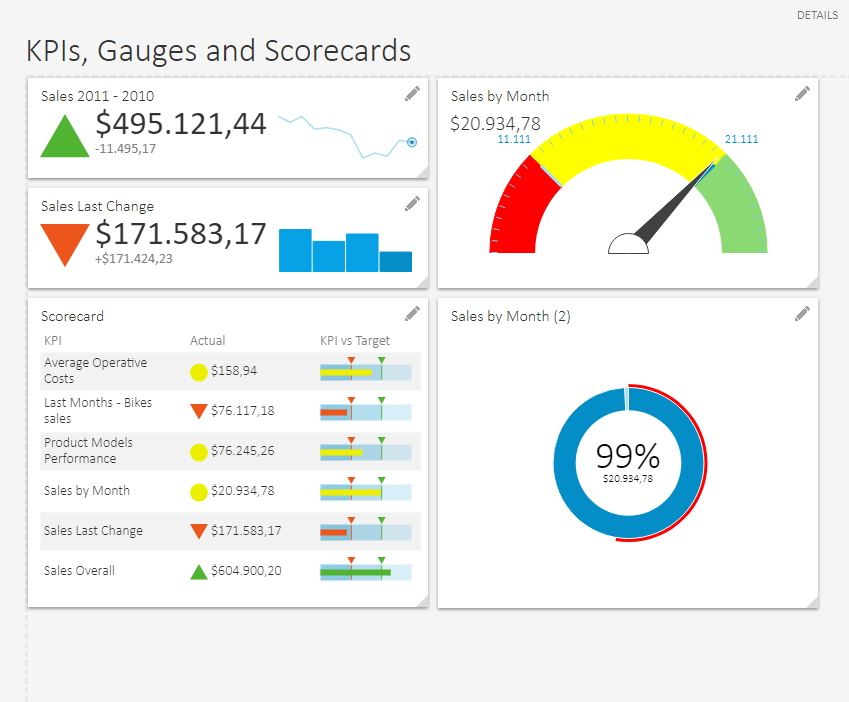
What if you could see all of your most important data as some sort of picture? Would it be worth more than 1k words? How much would it be worth to you to see your data clearly?
Predict 🔮
Once we know what has happened or is happening, we can start predicting the future. This may seem impossible or feel as sure as looking into a crystal ball. However, this is nothing more than an educated guess based on patterns of events happening over and over. The more information we can capture about each event historically, the better we can use these data points to help us understand the outcome before it actually happens.
Our brains do this naturally, we call it “seeing the writing on the wall”. Imagine you’re driving your car and hear a squeak or chirp but when you push the brake pedal the noise goes away. The sound of something wrong with your car shoots the cortisol through your veins and worries you a little so you go visit the mechanic.
After a check from your loyal-local mechanic you learn the chirping noise was actually just the brake wear indicator telling you your brakes need to be replaced soon. Next time you hear the noise, what will be your reaction? Will the same bead of sweat appear on your forehead?
Probably not.
You’ll know exactly what to do, because you’ve been down this road before, you recognize the pattern, and you have data from your past which helps you take actions in the future.

It turns out machines can do this a lot better than us and can do it with a lot more data. They recognize patterns even the trained eye can’t see.
Want to predict how to increase your sales? Data can help.
Want to predict if someone will buy an item? Just need the right information.
We can also use data to help us group/organize things.
Want to predict groupings of followers on social media? Just gather the information you think describes them the best.
How about recognizing patterns in customer feedback & natural language and organizing into topical groups to quickly understand what they are discussing? Yup, you can do that as well.
What if you could predict the future of your business? How could predicting the future of your sales or recognizing patterns in your business help you? What patterns do you think exist in your business?
Prescribe 💊
Data and information can also tell you the correct course of action to take. Like a prescription note you get from the doctor telling you exactly what to take next and how often, data can specifically help solve your ailments as well.
We see this a lot in the supply-chain world: how much to buy, where to ship, how many packages can we fit into a truck, etc. but we use some other strategies very consistently.

For example, a mapping app giving you step-by-step directions is actually just using data and information to select the best route for you based upon a lot of different inputs. If you’ve ever called into a service line and waited on the phone, the company is (or at least should be) tracking how long you are staying in the queue before you hang up.
What benefits could come from your data prescribing results to you? What questions do you have that you think your data could answer but you just don’t know how?
What can data do for you?
Data is so dynamic and can come from many different sources and in many different forms. The best way to think about the benefits of data is to bucket it into the three solutions: describe, predict, prescribe.
As you move from the path of describing your data, to using it to predict and eventually prescribe, the process is a little more rigorous but the rewards are more than equal to the task.
Start
The best way to start using data is to frame a question you have about your business and then see what data you need to support the idea.
I have a new service I am offering where I partner with you to help you realize the power of your data and the opportunities it holds. I’ll come work one-on-one or with your team to start thinking with a data mindset and show you how you can answer your business questions with data and/or how to get to that point.
What would it be worth to you to save money and have more efficiency in your business just by harnessing a resource you already have? Let me help show you how.

What can data do for you?
Contact me or set up a 15min. call